NQ · MNQ · 1-minute
Kernwell
Auction Lens
Failed-break detection and seller-zone context for NQ and MNQ.
Bring key parts of your chart analysis into one view. Identify look-above-and-fail and look-below-and-fail events, monitor nearby inferred seller zones, and see which conditions contribute to a bullish setup.
For Nasdaq futures traders who want a consistent confirmation process around potential reversals. A student-built TradingView indicator.
- Monthly · 30 days
- $79.99once
- Annual · 1 year upfront
- $799.99once
Plus applicable sales tax. No automatic renewal. Refunds within 3 days of payment.
The trader’s problem
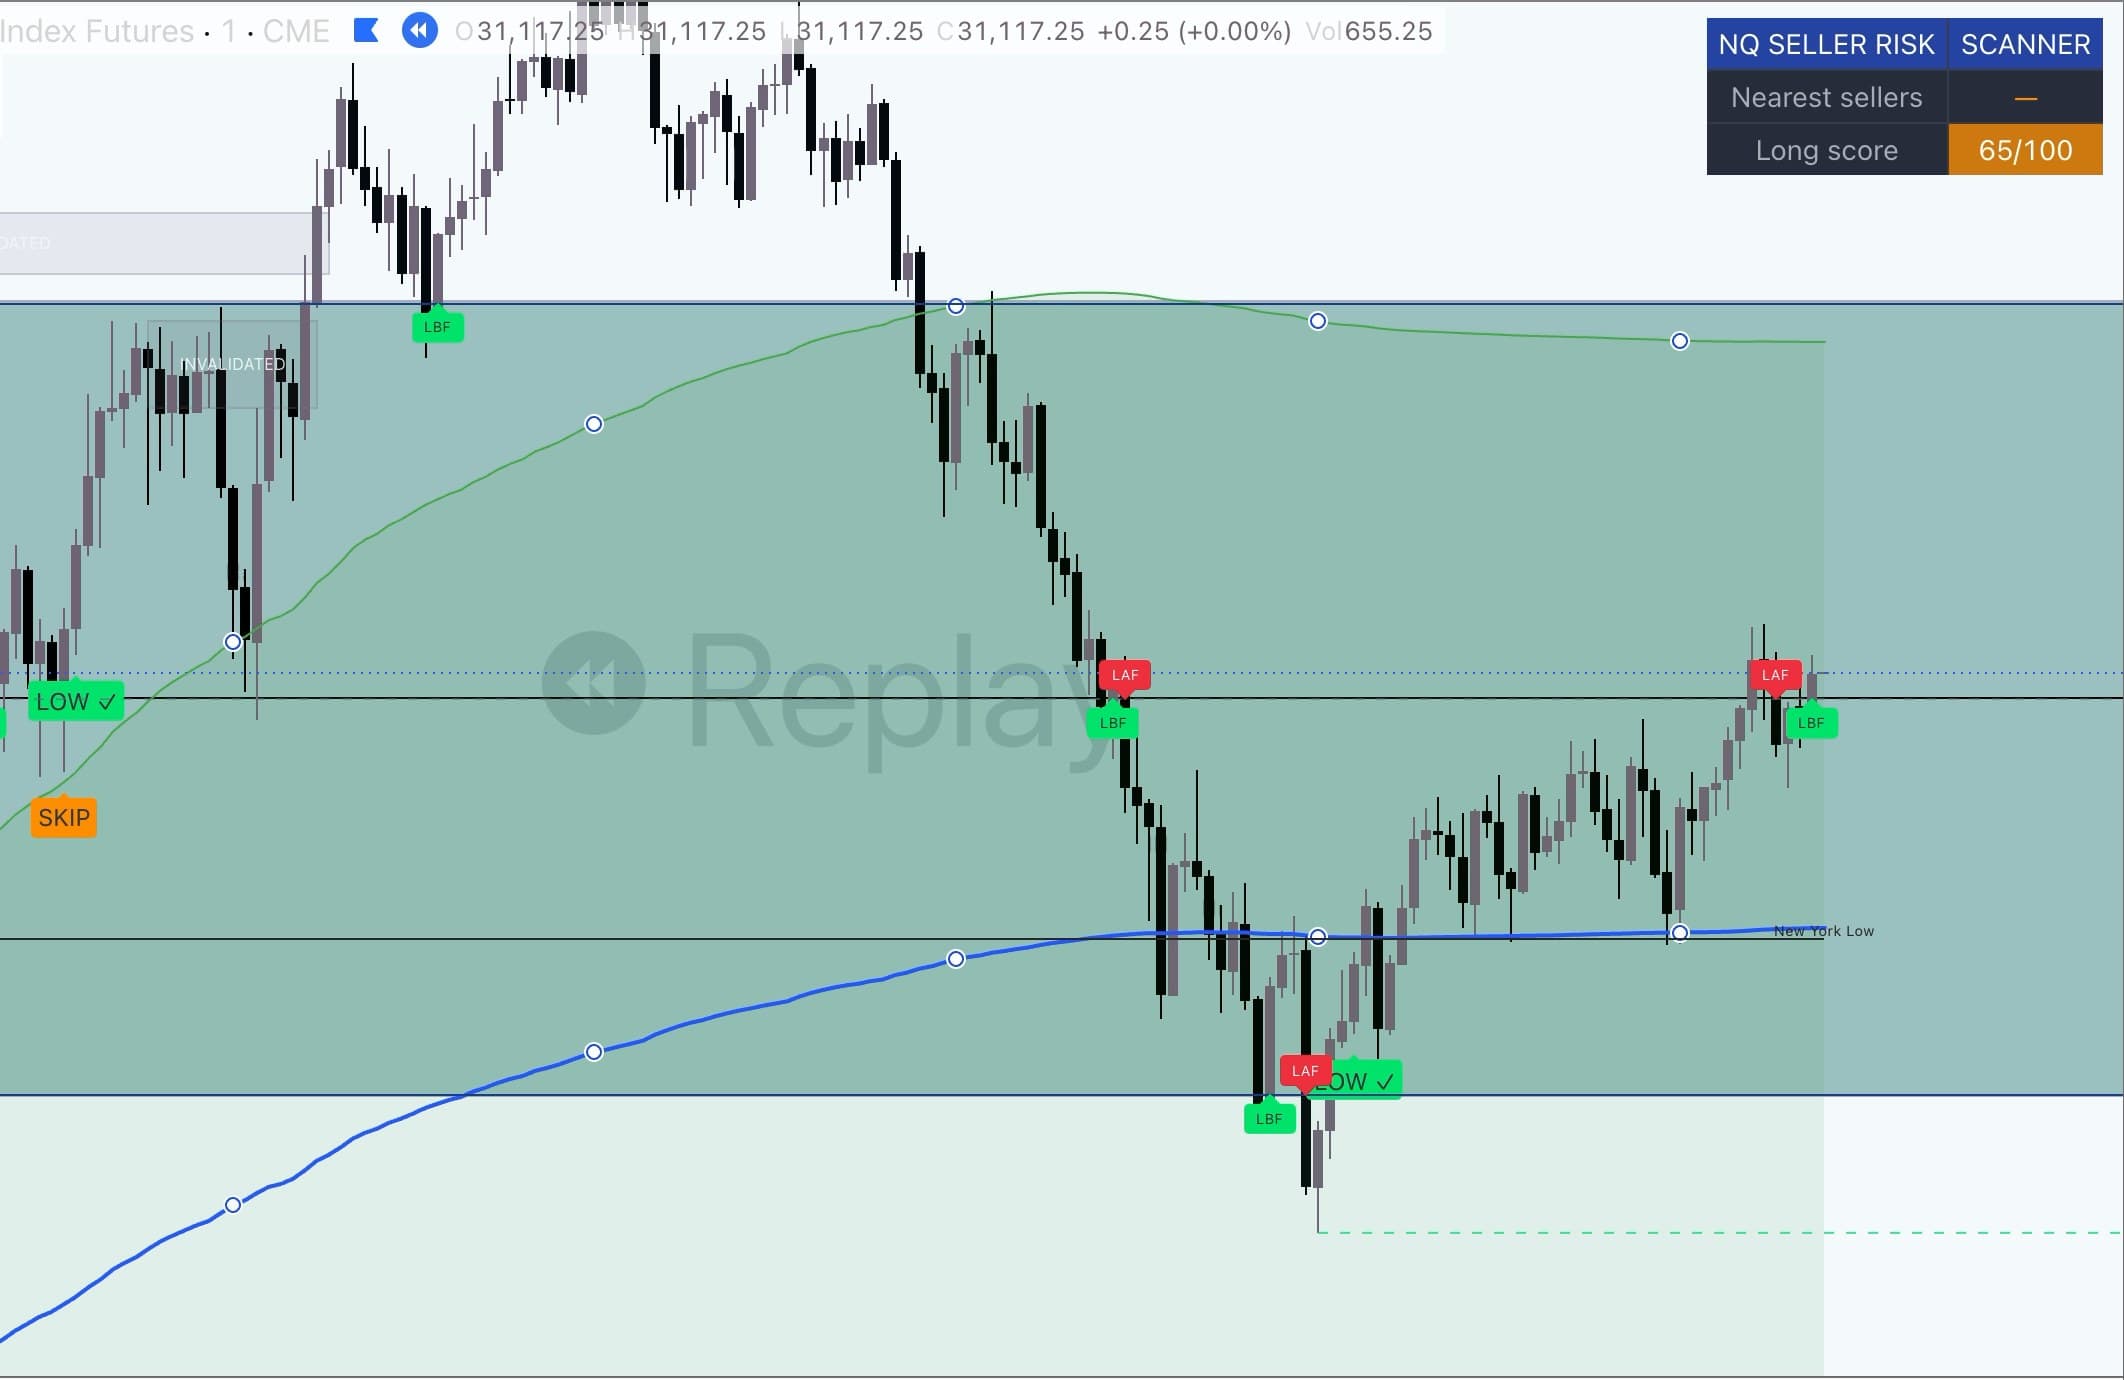
Thought that was the bottom?
Then price kept falling.
Potential turning points can leave you entering early, chasing a move, or second-guessing the setup. Auction Lens makes its defined failed-break conditions and supporting context visible, giving you a repeatable checklist to review alongside your own method.
It will not stop a market falling, and it does not find the final high or low. The chart here shows that honestly: a failed break printed partway down, and price still went lower before the next one.
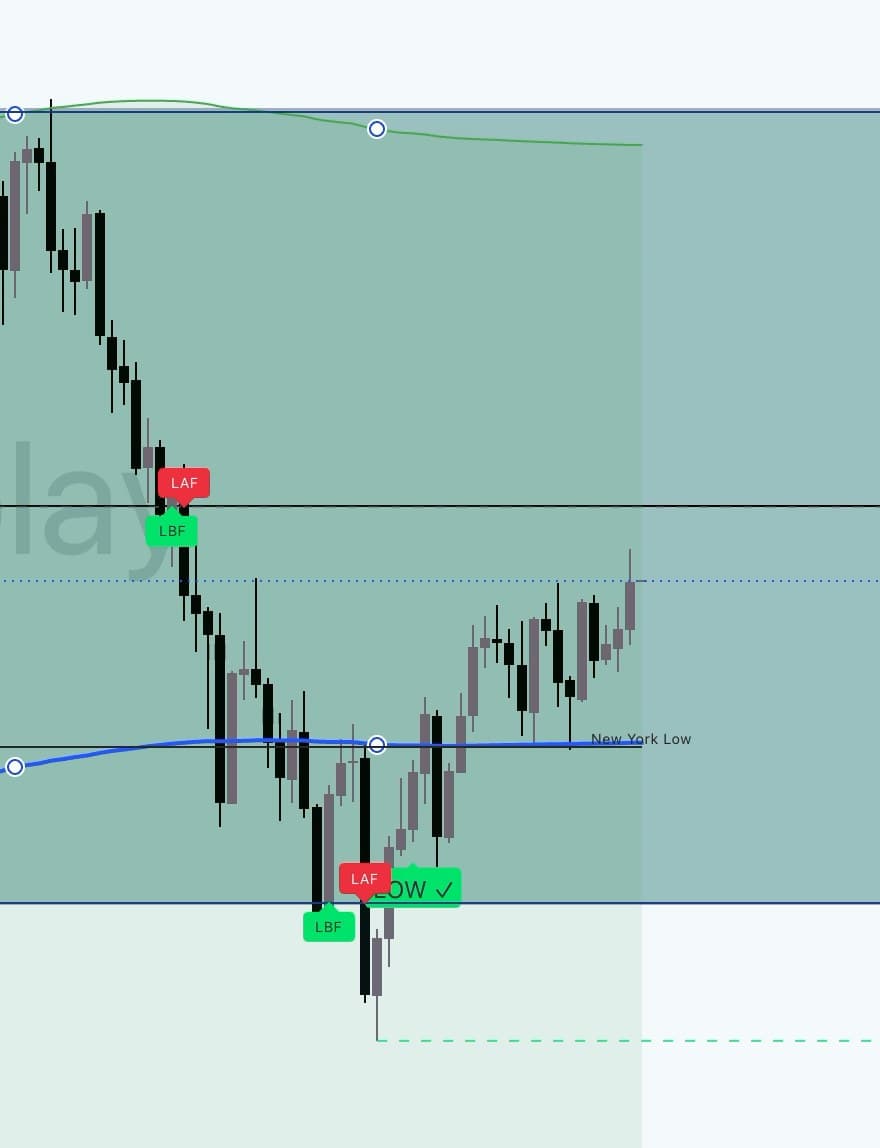
The same session, mid-decline

Walkthrough
Meet Auction Lens.
A clearer view of failed breaks, the seller-zone context around them, and the checklist behind each long setup.
Walkthrough in production
The full chart walkthrough is being edited.
Until it is ready, every image on this page is a still from the same original recording.
01 · Look Above and Fail · Look Below and Fail
Spot failed moves across defined levels
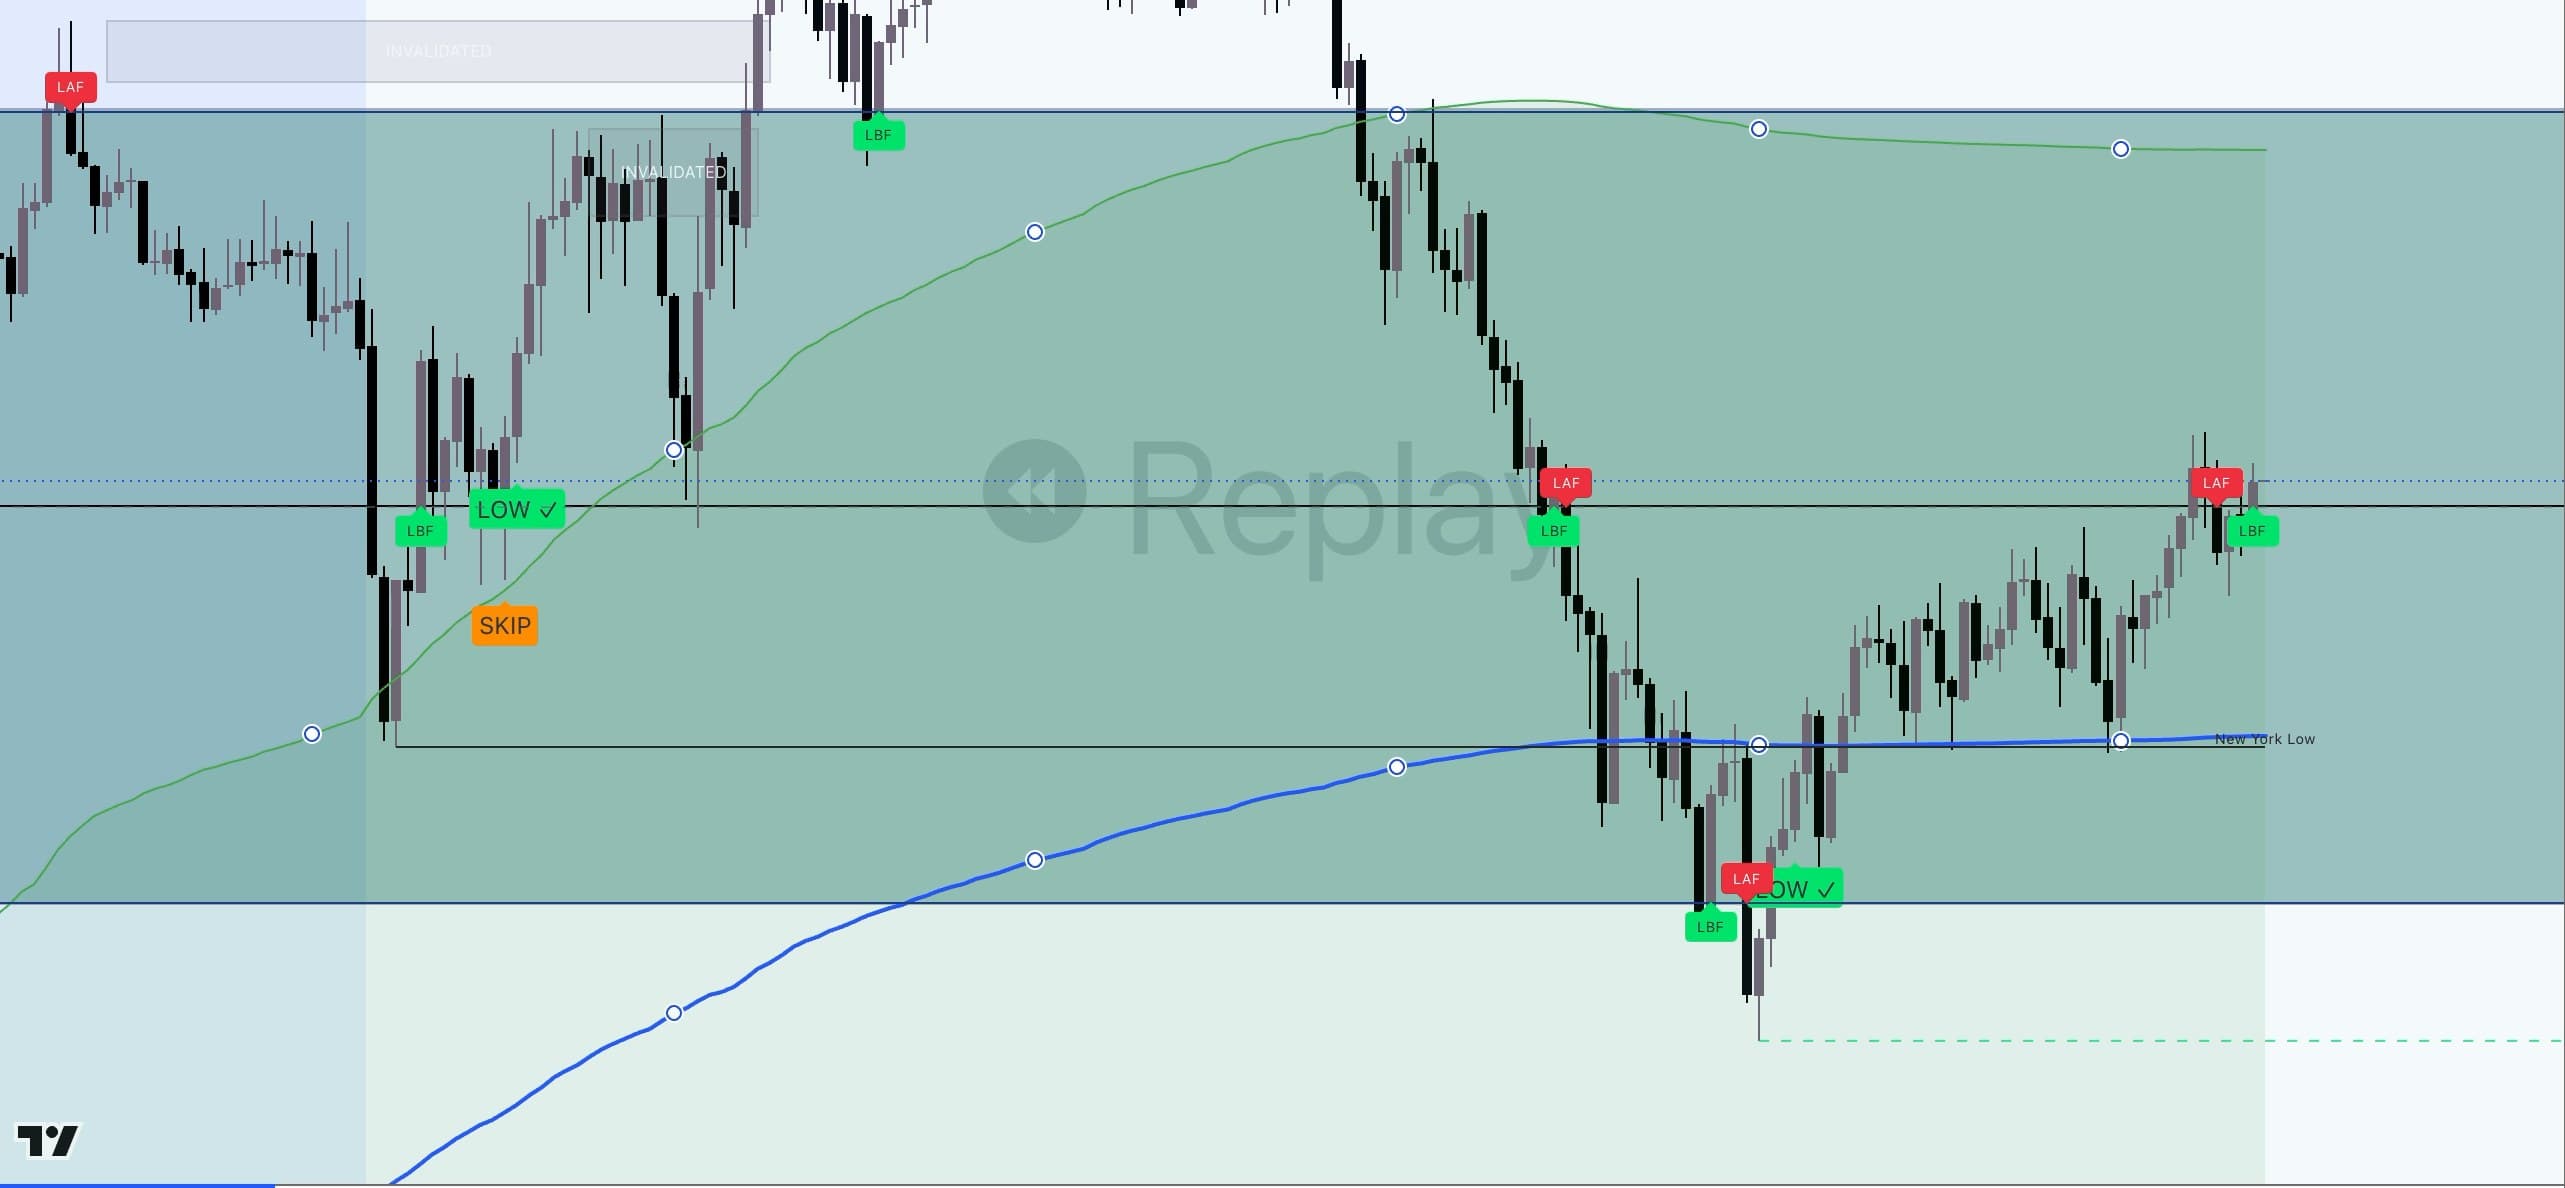
Auction Lens automatically marks Look Above and Fail (LAF) and Look Below and Fail (LBF) events when price crosses a configured grid boundary and closes decisively back across it within the confirmation window.
Markers confirm at candle close, making the qualifying failed break visible on your chart.
See the break. See the return. See the confirmation.
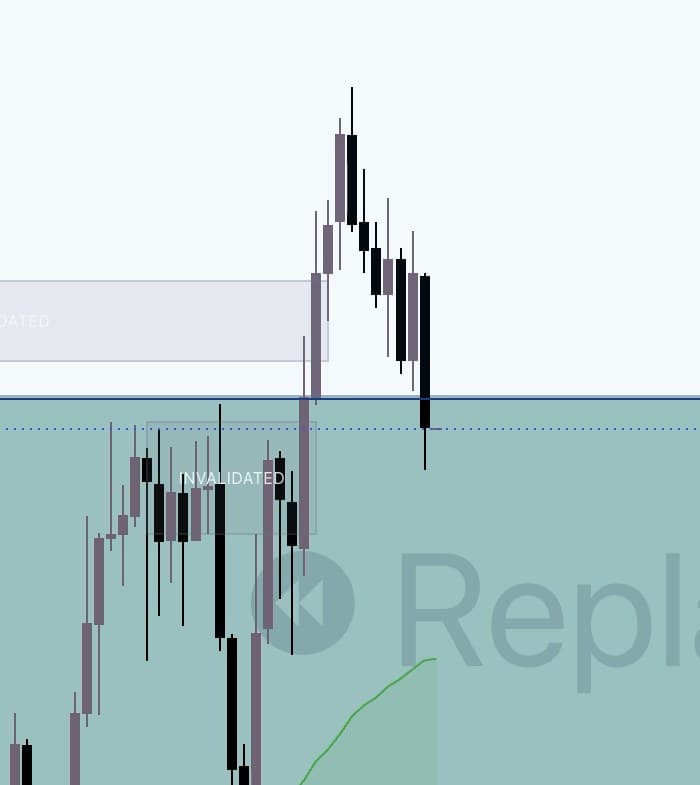
1 · The break
Price has pushed up through the upper grid boundary, and this candle closes back below it. Nothing has printed yet.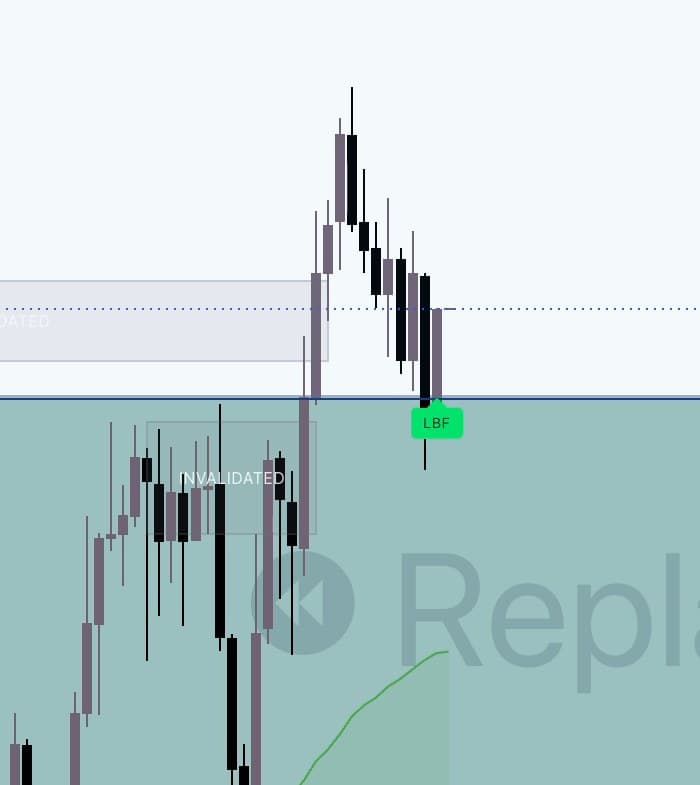
2 · The return
Within the confirmation window, the next candle closes decisively back above the same boundary. The LBF prints on that close — not before it.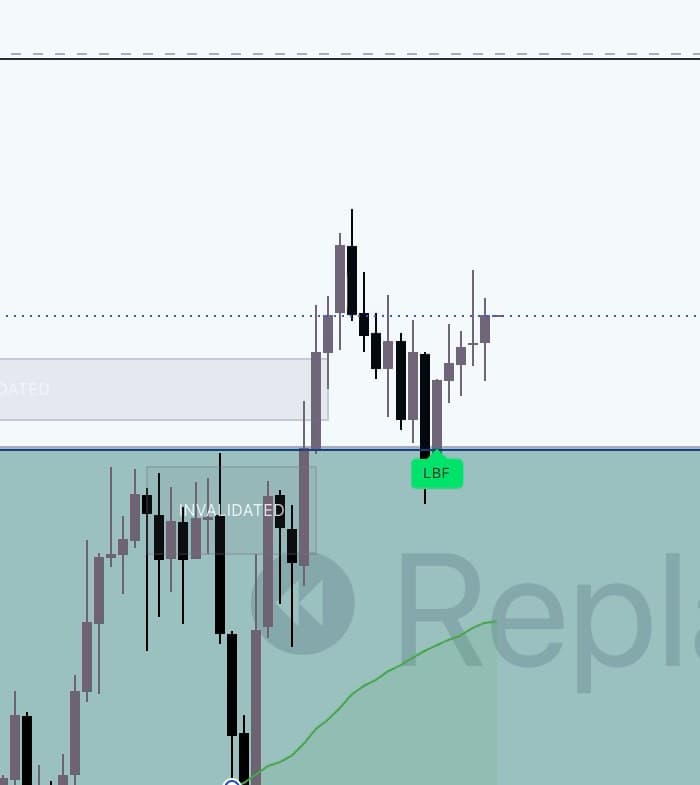
3 · The confirmation
Once confirmed, the LBF stays where it printed. Here later candles traded above the boundary; a failed break is a condition to review, not a promise of what comes next.
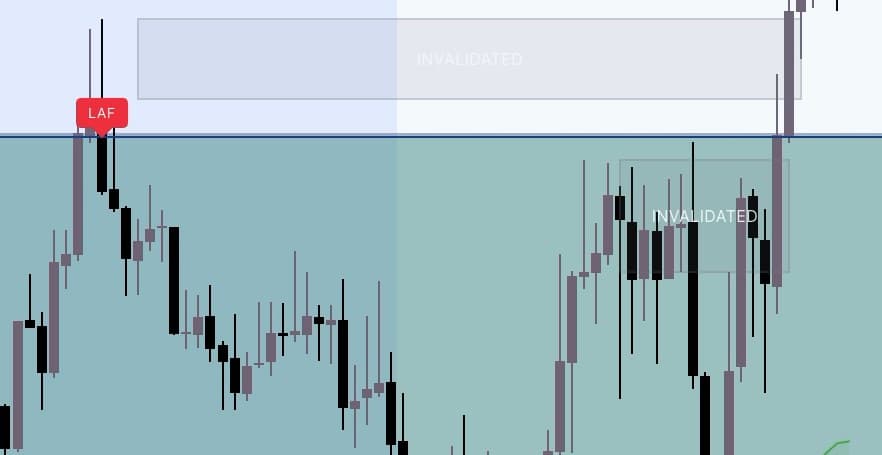
The other direction: Look Above and Fail
Worth knowing
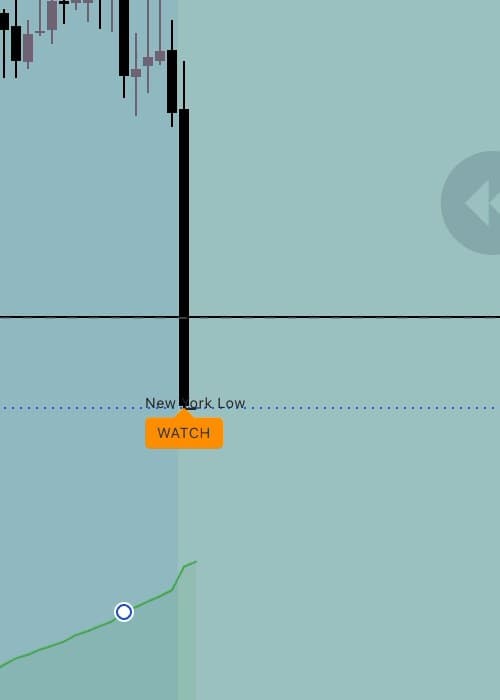
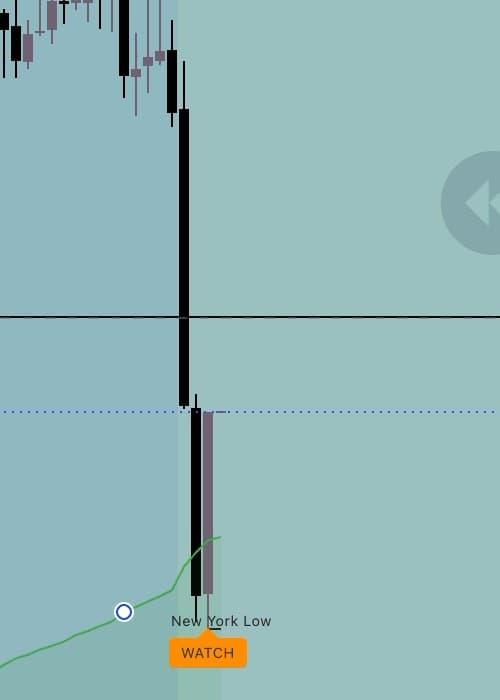
The WATCH marker moves. LAF and LBF do not.
WATCH is a preliminary flag at a potential exhaustion low, and it relocates as lower lows form — these two captures are one bar apart. LAF and LBF confirm at candle close. We do not describe the indicator as a whole as non-repainting.
02 · Nearest Sellers
See nearby potential resistance
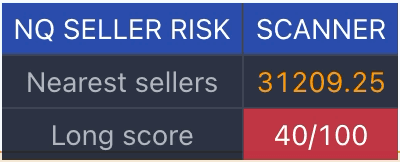
The Nearest Sellers dashboard highlights the nearest qualifying active seller zone above or containing current price.
Zones are estimated from confirmed pivot highs, candle structure, and relative volume, providing price-and-volume context for nearby potential resistance.
These are inferred zones. They are not actual seller holdings, order-book data, or identifiable participants.
03 · Long Score
Read bullish conditions at a glance
The Long Score combines price relative to VWAP and zone midpoints, bullish momentum, relative volume, and recent look-below-and-fail confirmation into a score out of 100.
It measures alignment with the indicator’s rules—not the probability of a winning trade.
A score of 80 means more of the rule conditions are met. It does not mean an 80% chance of success.
- Price relative to VWAP and the zone midpoint
- Bullish momentum
- Relative volume
- A recent look-below-and-fail
Score ≠ win probability. It counts rule conditions. 80/100 means more conditions are met — not an 80% chance of success.
04 · Reference levels
Add structure to your chart
View anchored VWAP and optional bands, a configurable fixed-price grid, and named session lows alongside setup markers.
Keep these reference levels in the same chart view as the failed-break events.
05 · Long-setup scanner
Review filtered long setups
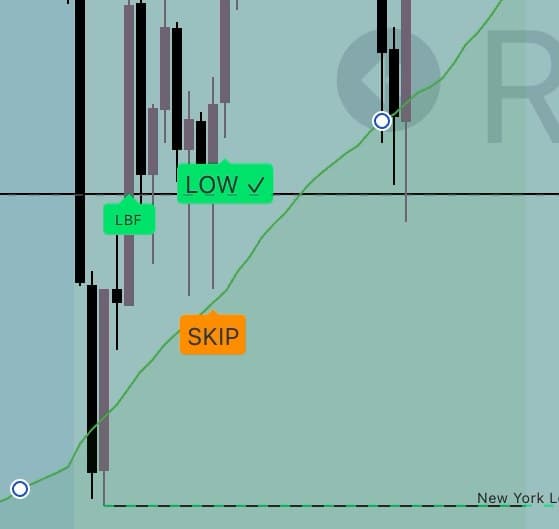
The built-in scanner checks for a confirmed low, a recent look-below-and-fail event, a qualifying retest, and additional trend, volume, risk, reward, and seller-zone filters.
Qualifying setups can display a chart-based entry, stop, target, and estimated contract quantity using your entered risk settings.
These are chart plans, not executed trades. The scanner looks for long setups only.
The scanner’s default window is 9:30–10:00 a.m. New York time, and you can change it.
Risk sizing uses the balance, drawdown and risk figures you type in. The script cannot see your broker account, balance or fills.
- A confirmed low
- A recent look-below-and-fail
- A qualifying retest
- Trend and volume filters
- Risk and reward limits
- No active seller zone in the way
When a setup does not qualify
Pricing
Put structure behind your next decision.
Both options include the same indicator features. Checkout is handled securely by Whop.
Monthly
$79.99
for 30 days of access
Paid once. Does not renew — buy again to continue.
- Every indicator feature
- NQ and MNQ, one-minute chart
- Manual TradingView activation
Secure checkout on Whop, plus applicable sales tax. It asks for your TradingView username.
Annual
$799.99
paid upfront for one year
Paid once. Does not renew. Saves $159.89 — nearly 17% — compared with twelve monthly payments.
- Every indicator feature
- NQ and MNQ, one-minute chart
- Manual TradingView activation
Secure checkout on Whop, plus applicable sales tax. It asks for your TradingView username.
In the Kernwell program
Auction Lens is intended to be one of the tools used in the program; access details are confirmed with the program. Buying Auction Lens on its own includes the indicator only — not the educational program.
About the programNo renewals. 3-day refund window.
Neither plan renews automatically. Monthly is 30 days of access and annual is one year, each paid once; buy again to continue. You can request a refund within 3 days of a payment. After 3 days, that payment is non-refundable. A refund ends access immediately. Prices exclude sales tax, which Whop adds at checkout where it applies.
Refund policyHow access works
Manual TradingView activation
- 1
Purchase access
Choose 30 days or one year, checked out securely on Whop. Your checkout email receives the receipt and your onboarding messages.
- 2
Give us your TradingView username
Checkout asks for it, and we keep it against your verified order. Only the username — never a password. It does not need to match the email you checked out with.
- 3
We grant access manually
Auction Lens is an invite-only TradingView script. A member of the Kernwell team adds your username to it by hand.
- 4
Add it to your chart
We email your checkout address with the indicator link and instructions for adding it to a one-minute NQ or MNQ chart.
Access is granted by a person, so it is not instant. Once it has been granted, we email the indicator link and instructions to your checkout address. We will never ask for your TradingView password.
Which symbols and timeframe does Auction Lens support?
Nasdaq-100 futures — NQ and MNQ — on the one-minute chart in TradingView. The scanner checks the symbol and timeframe and stays inactive elsewhere, and the fixed-price grid is set up for NQ price levels.
What do LAF and LBF mean?
LAF is Look Above and Fail: price crosses above a configured grid boundary and then closes decisively back below it within the confirmation window. LBF is Look Below and Fail, the same in the other direction. Both confirm at candle close. A failed break is a condition the indicator reports — it does not mean price will reverse.
What does the long score measure?
How many of the indicator’s bullish conditions are present right now: price relative to VWAP and the zone midpoint, bullish momentum, relative volume, and a recent look-below-and-fail. It is a checklist score out of 100. It is not the probability of a winning trade — a score of 80 is not an 80% chance of anything.
How are seller zones inferred?
From confirmed pivot highs, the structure of the candle that made them (such as upper-wick size), and relative volume. A zone stays active until price invalidates it. These are estimates drawn from price and volume. They do not show real orders, holdings, or who is trading.
Does Auction Lens place trades or read my account?
No. It is a TradingView indicator. It does not execute trades and cannot read your broker balance, positions, or fills. Any risk sizing it shows uses numbers you type into its settings, and scanner plans are drawn on the chart — they are not orders.
Is it non-repainting?
Not as a whole, and we do not claim it is. LAF and LBF markers confirm at candle close, and seller pivots wait for confirmation bars. The preliminary WATCH marker, by design, moves as lower lows form.
How does TradingView activation work?
Auction Lens is an invite-only script. Checkout asks for your TradingView username, which we keep against your verified order. A member of our team adds that username to the script by hand — it is not instant — and once access has been granted we email your checkout address with the indicator link and instructions for adding it to your chart. We never ask for your TradingView password, and your TradingView login email does not need to match your checkout email.
What is the difference between monthly and annual?
The features are identical. Monthly is $79.99 for 30 days of access. Annual is $799.99, paid upfront for one year — $159.89 less than twelve monthly payments, which is nearly 17%. Neither renews automatically: when your period ends, access ends, and you can buy again to continue.
What is the refund policy?
You can request a refund within 3 days of a payment by emailing support@kernwellsystems.com from your checkout email address. After 3 days, that payment is non-refundable. This applies to each monthly purchase and to the annual purchase. If a payment is refunded, access to the indicator ends immediately.
Is Auction Lens included in the Kernwell program?
Auction Lens is intended to be one of the tools used in the Kernwell program. The details of program access are confirmed with the program, not on this page. Buying Auction Lens on its own gives you the indicator only — it does not include the educational program.
Is this the Market Analysis Suite?
No. Auction Lens is a separate, student-built indicator with its own price. The Market Analysis Suite is a different product, priced and sold separately, and so is the founder’s own indicator when it is released.
TradingView historical replay, MNQ1! 1-minute, Fri 2 Oct 2026. Cropped from the original recording; labels and values unaltered.
Kernwell Auction Lens is chart-analysis software. It does not execute trades, read broker balances or fills, or provide personalized investment or futures advice, and no trading outcome is guaranteed. Trading futures involves substantial risk of loss and is not suitable for every investor. Past performance is not necessarily indicative of future results. TradingView is a trademark of its owner; Kernwell is not affiliated with TradingView.